Regarding model interpretability, in addition to linear models and decision trees, which are inherently well interpretable, many models in sklean have the importance interface, and you can view the importance of features.
Classic global feature importance
using the plot_importance() method gives an attractively simple bar-chart representing the importance of each feature in our dataset
-
Weight. The number of times a feature is used to split the data across all trees.
xgboot.plot_importance(model, importance_type=”weight”)
-
Cover. The number of times a feature is used to split the data across all trees weighted by the number of training data points that go through those splits.
xgboot.plot_importance(model, importance_type=”cover”)
-
Gain. The average training loss reduction gained when using a feature for splitting.
xgboot.plot_importance(model, importance_type=”gain”)
Common importance evaluation methods
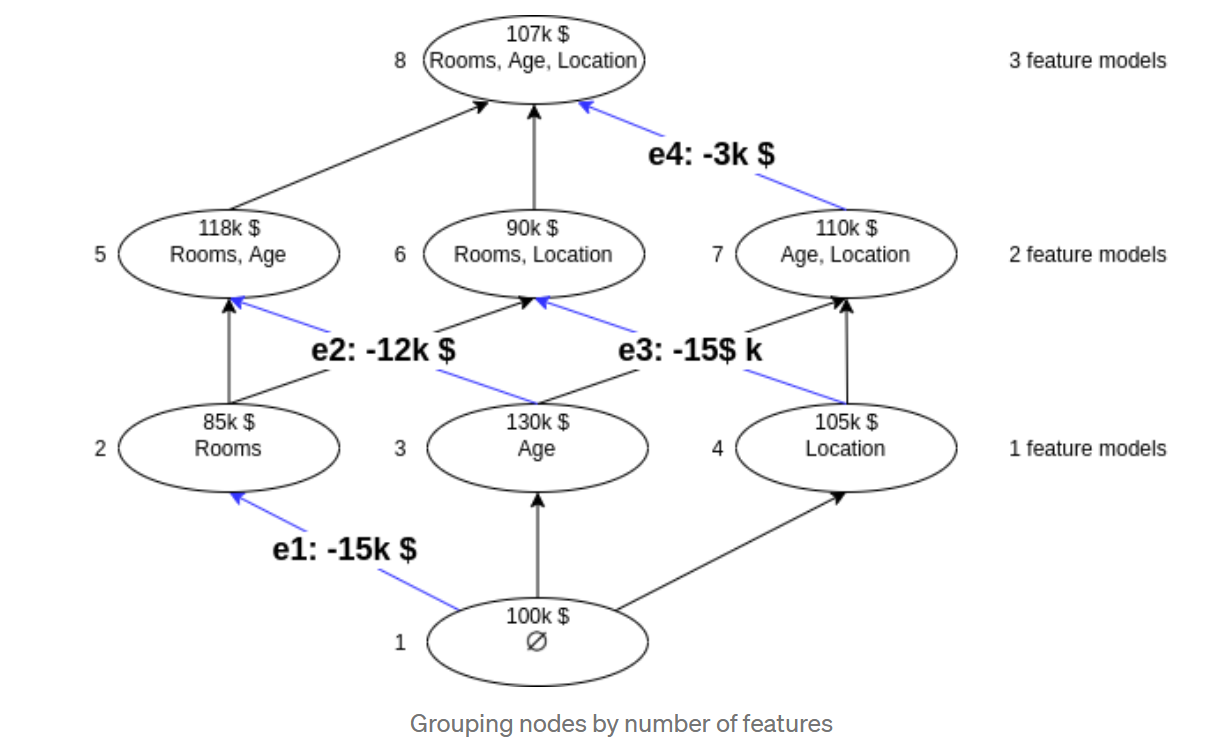
SHAP (SHapley Additive exPlanations)
A new individualized method that is both consistent and accurate. it shows not only importance of a feature but also show positiveness or negtiveness.
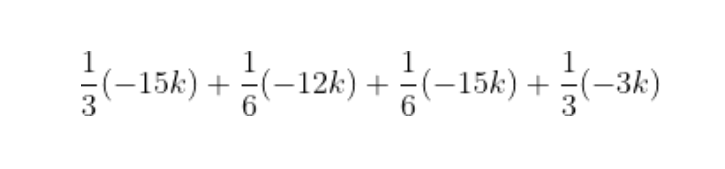
below is an example to show SHAP value of room feature.
 The shap Python package makes SHAP easier. We first call shap.TreeExplainer(model).shap_values(X) to explain every prediction, then call shap.summary_plot(shap_values, X) to plot these explanations
explainer
- deep works for deep learning model, based on DeepLIFT algos
-
gradient
-
kernel works for any model
-
linear Linear model with independent and uncorrelated features
-
tree
import shap shap.initjs() X,y = shap.datasets.boston() model = xgboost.train({“learning_rate”: 0.01}, xgboost.DMatrix(X, label=y), 100) #there are many explainer available, here use tree explainer for example explainer = shap.TreeExplainer(model) shap_values = explainer.shap_values(X)
-
sampling based on hypothesis that feature independence
-
kerne
#using kmeans X_train_summary = shap.kmeans(X_train, 10) t0 = time.time() explainerKNN = shap.KernelExplainer(knn.predict, X_train_summary) shap_values_KNN_train = explainerKNN.shap_values(X_train) shap_values_KNN_test = explainerKNN.shap_values(X_test) timeit=time.time()-t0 timeit
visualization
Local Interper
-
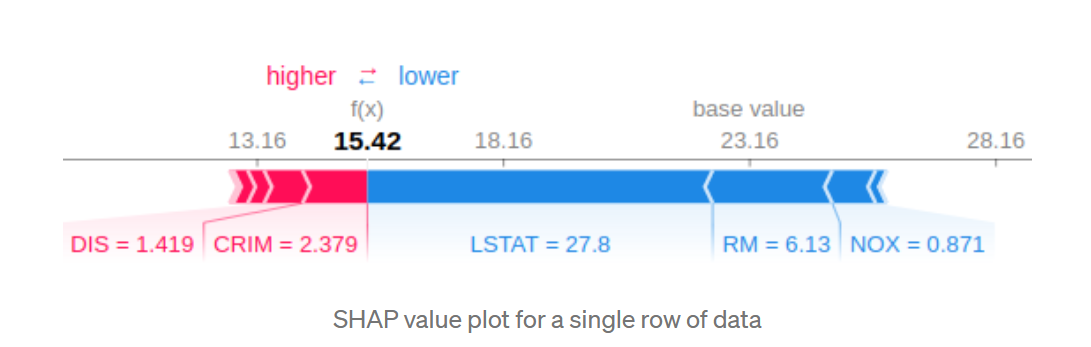
single prediction display contribution of each feature for one prediction
shap.force_plot(explainer.expected_value, shap_values[0,:], X.iloc[0,:])
-
multi predictions
shap.force_plot(explainer.expected_value, shap_values, X)
Global Interper
explanation of the overall structure of the model
-
summary_plot
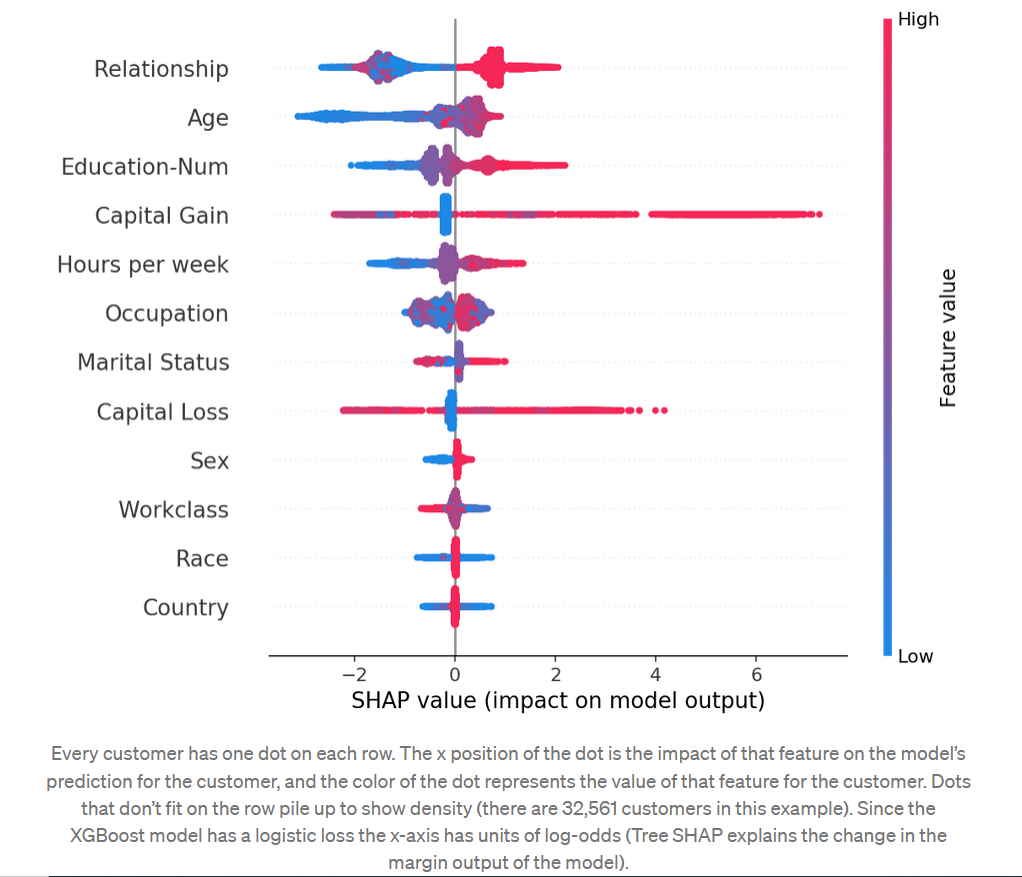
#summarize the effects of all the features shap.summary_plot(shap_values, X)
-
Feature Importance
shap.summary_plot(shap_values, X, plot_type=”bar”)
-
Interaction Values
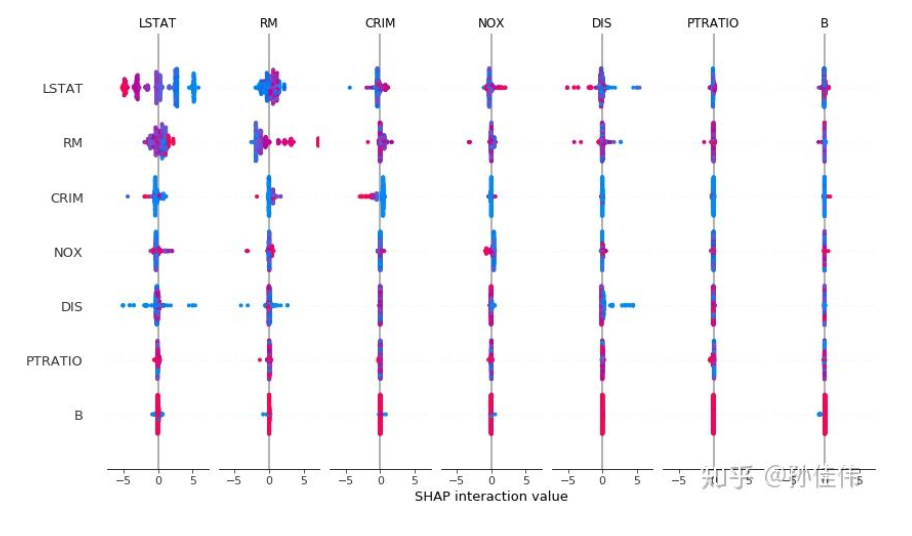
shap_interaction_values = explainer.shap_interaction_values(X) shap.summary_plot(shap_interaction_values, X)
-
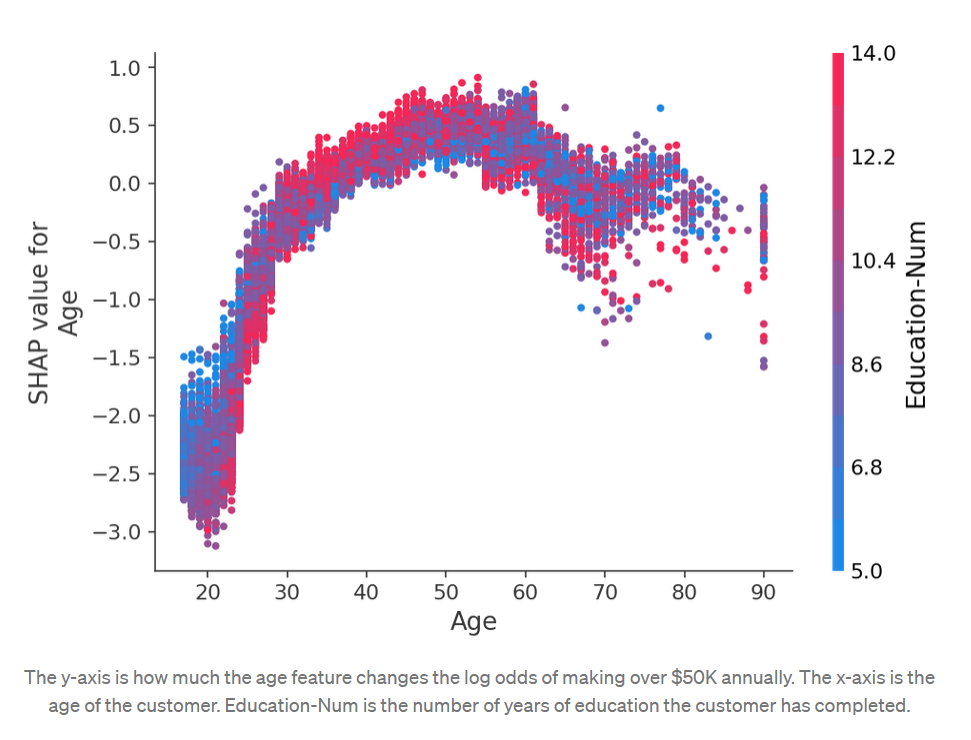
dependence_plot
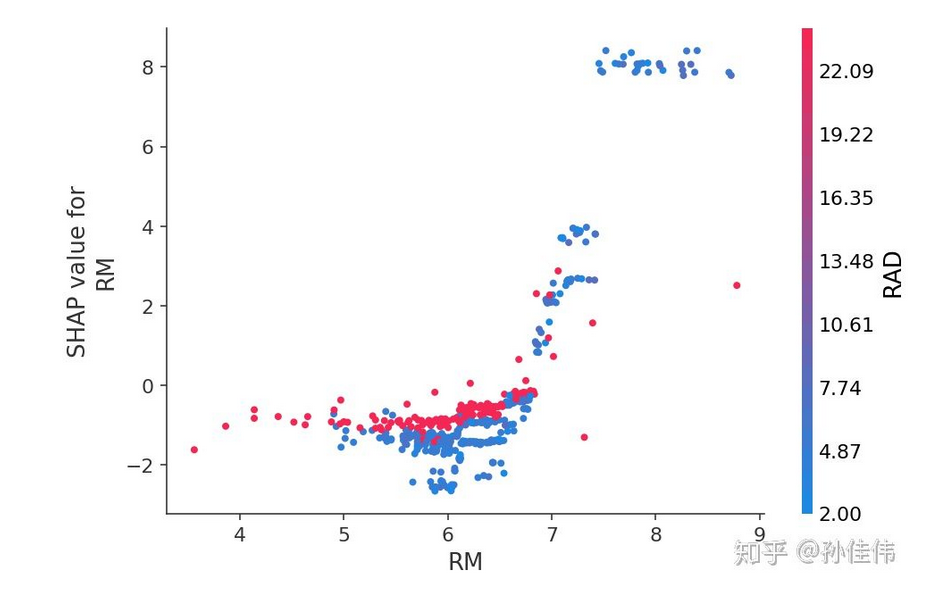
#create a SHAP dependence plot to show the effect of a single feature across the whole dataset
shap.dependence_plot(“RM”, shap_values, X) -
permutation importance https://github.com/Qiuyan918/Permutation_Importance_Experiment
visualization of network
-
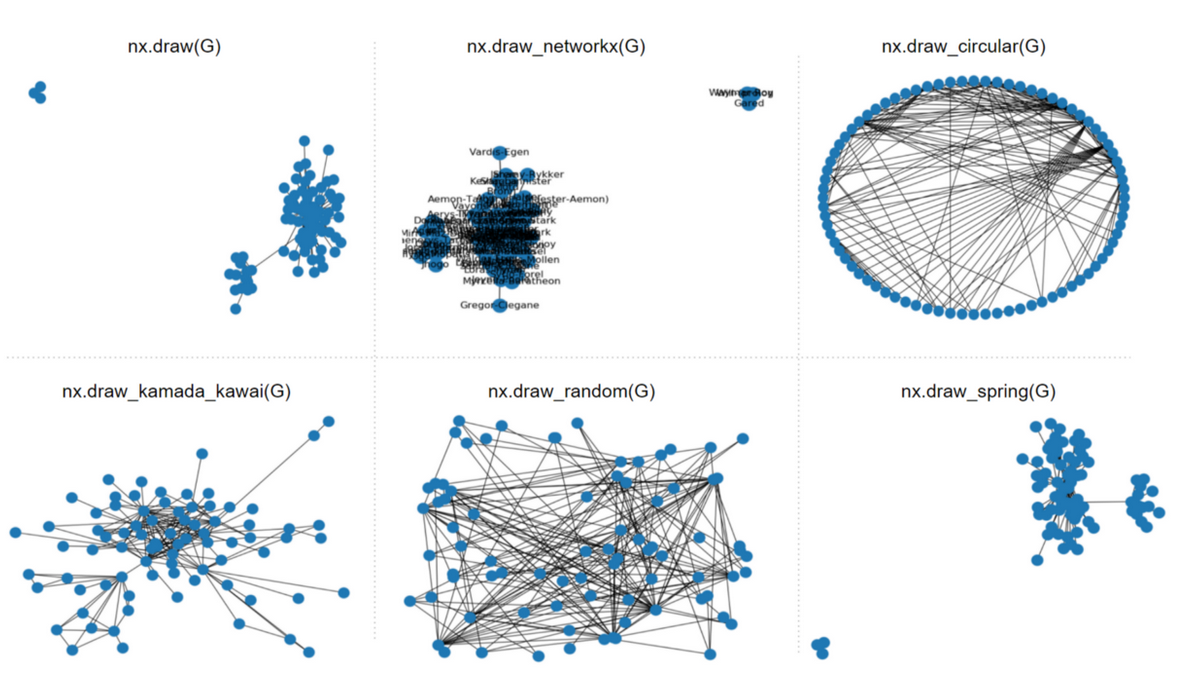
Networkx non interactive visualization of Graph
import networkx as nx G = nx.from_pandas_edgelist(df, source=’Source’, target=’Target’,edge_attr=’weight’)
the network can be visualized with following functions.
-
PyVis interactive visualization of network Graph
from pyvis.network import Network net=Network(notebook=True) net.from_nx(G) net.show(“test.html”)
-
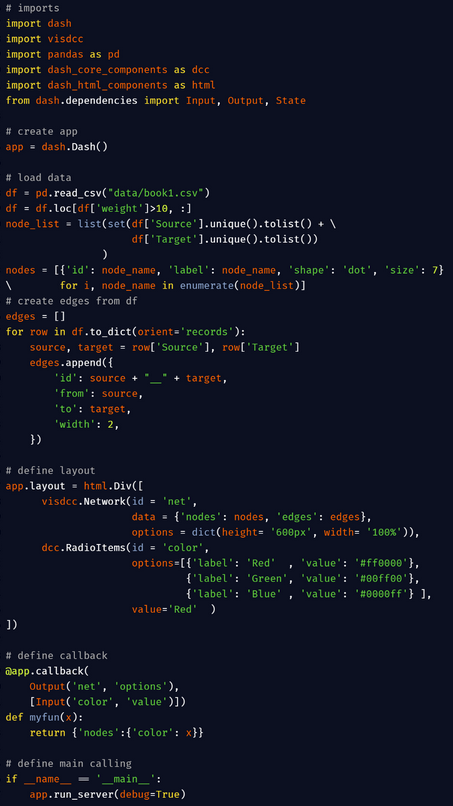
visdcc in dash
Saabas.
An individualized heuristic feature attribution method.
mean(|Tree SHAP|).
A global attribution method based on the average magnitude of the individualized Tree SHAP attributions.
Gain.
The same method used above in XGBoost, and also equivalent to the Gini importance measure used in scikit-learn tree models.
Split count.
Represents both the closely related “weight” and “cover” methods in XGBoost, but is computed using the “weight” method.
Permutation.
The resulting drop in accuracy of the model when a single feature is randomly permuted in the test data set.
* train model on dataset A
* test model on dataset B, get MSE and loglos
* random permute one feature in dataset B, and test again. the difference of scores between 2 and 3 is permutation importance