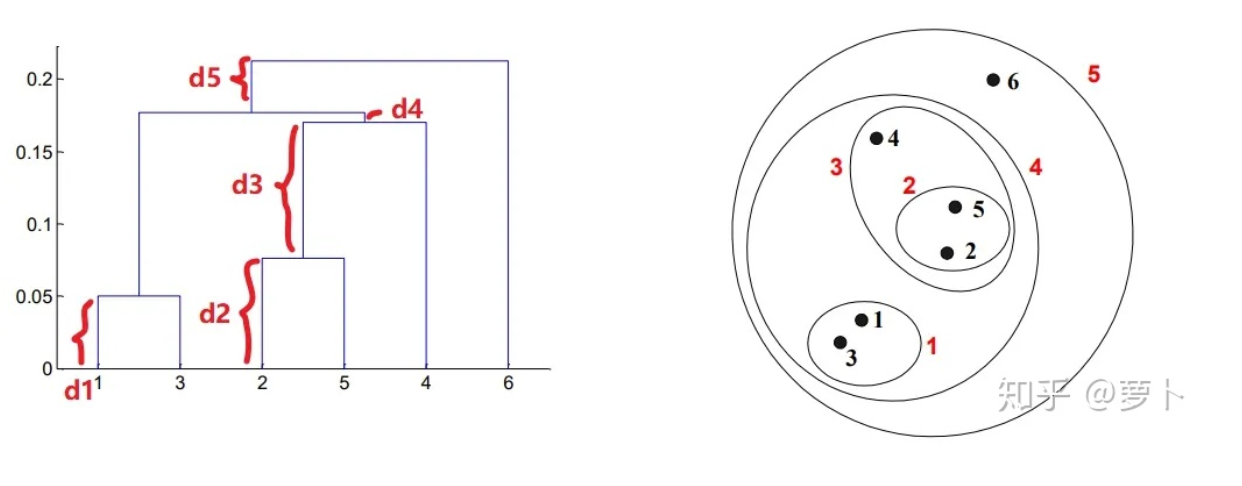
The hierarchical tree is composed of small trees, each small tree represents a class, and the height of the small tree is the distance between two points or two classes, so the closer the distance between two points, the shorter the tree
import pandas as pd
import numpy as np
import matplotlib.pyplot as plt

df = pd.read_csv('城市经济.csv')
import scipy.cluster.hierarchy as sch

disMat = sch.distance.pdist(X=df[['Gross', 'Avg']], metric='euclidean')

Z = sch.linkage(disMat,method='ward')
P = sch.dendrogram(Z, labels=df.AREA.tolist())
plt.savefig('聚类结果.png')